Rollcage
I used to take part in the McMaster Solar Car Project (MSCP) at McMaster University as the Chassis Team Lead. The team researches, designs, and builds aerodynamic, solar powered, endurance race vehicles. During a race, we go as far as we’re able to with only the pre-charged battery power and the whatever extra charge we can get from the panels as we go, assuming we don’t break down first. If you want to find out more about the team, this is the MSCP website.
I made this rollcage in my first year on the team. It was a great experience to design something so important right off the bat. That year, the team was trying to recreate the previous chassis because there was no documentation to prove that it was safe, it had been lost when students graduated. As part of the redesign we needed to design the rollcage. The aeroshell design was already set so this rollcage had to be small but also strong to meet specific safety standards. There needed to be a gap all around the driver’s head so it couldn’t hit in an accident. The cage also needed to allow the driver to escape quickly if necessary. On top of that, it needed to be able to withstand 5 times the force of gravity on the car from the front and side. In case of a roll-over, the roll cage needed to withstand 5 times the forces of gravity on the car from the top, and 1.5 times the force of gravity on the car from both the front and side. The rollcage is made of 4130 Chromoly Steel tube, I chose this material because it has a great strength to weight ratio and is already a popular for chassis and rollcages. The specific diameter and wall thickness of the tubing, although also popular, was chosen for its stiffness and strength to weight ratios.
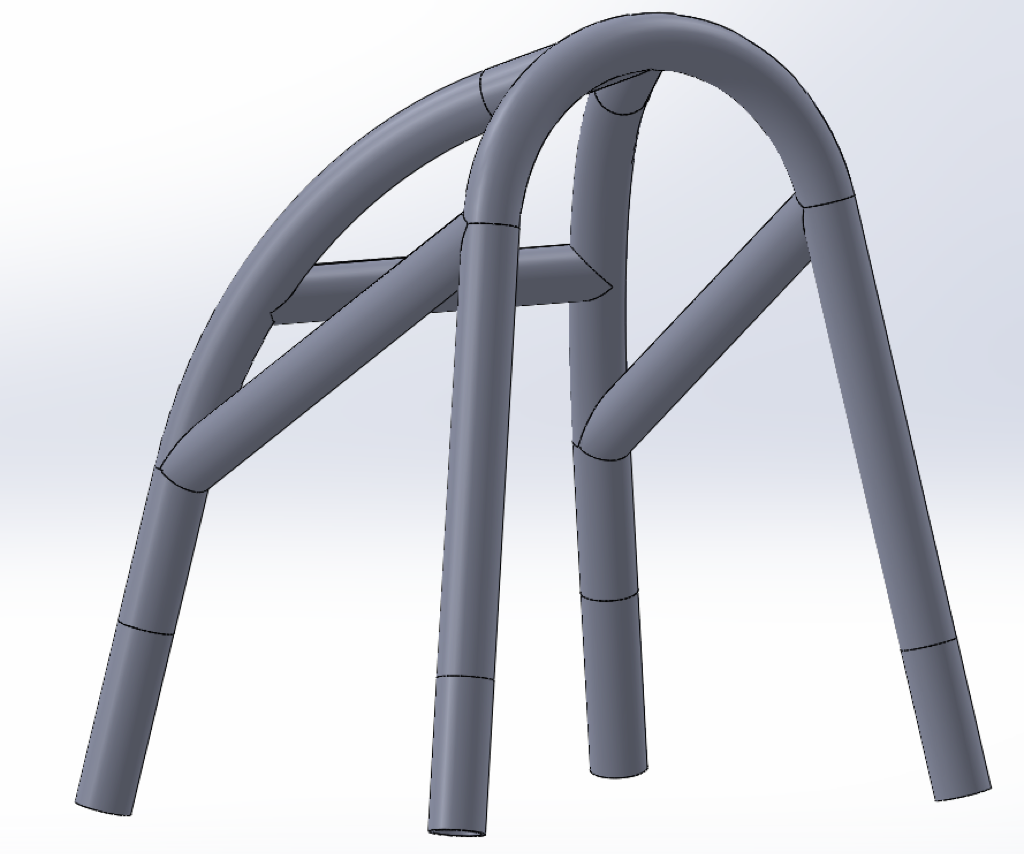
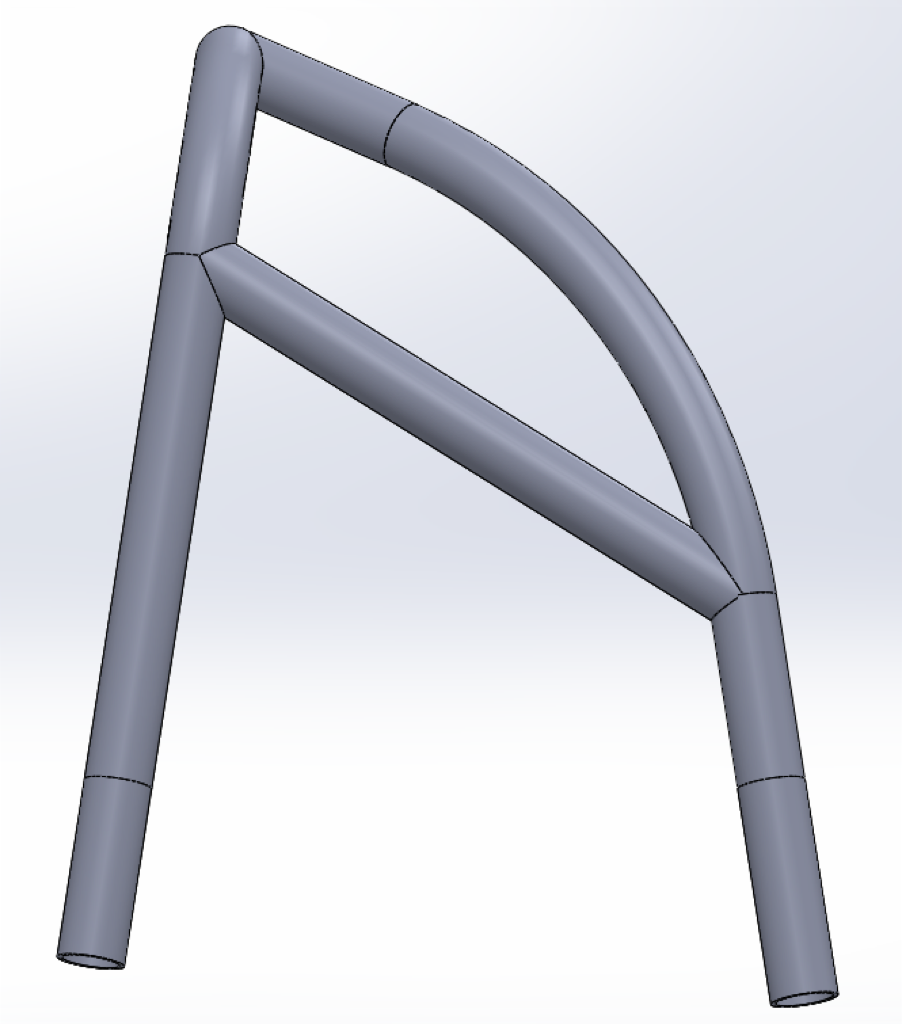
This is the roll cage I designed in SolidWorks based on all the requirements above. The aeroshell area covering this was not symmetric which meant that one side of the rollcage was weaker than the other. So all of the side impact stress simulations needed to be run on both sides to ensure one side was not failing.
I worked on this roll cage for about 5 months and went through numerous iterations before settling on this design. I optimized the material diameter and wall size, as well as tubing placement. I ensured it would be easy to manufacture. It never did end up getting manufactured as we made a strategic switch from the Challenger Class to the Cruiser Class vehicles for the next season. See my aeroshell frame project for more information about that.
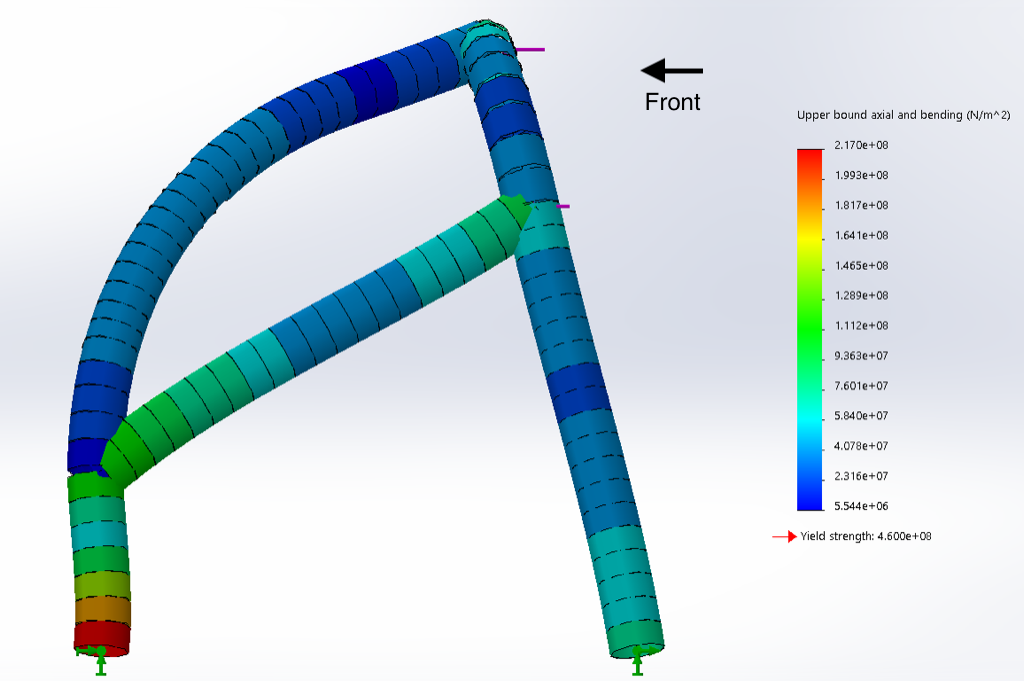
This is a force simulation applied to the front of the roll cage. Based on an estimated mass of 450kg, 5x the force of gravity was applied on the front. This image shows the force distribution through the structure due to the applied force. The blue areas are where the least amount of stress is experienced. The red areas are where the most amount of stress is experienced. The units in this image are in Pascals. You can see that the maximum stress experienced is 2.17 x 10^8 Pa, and as shown below the bar, the yield strength of the material is 4.6 x 10^8 Pa, which is well above the maximum stress seen.
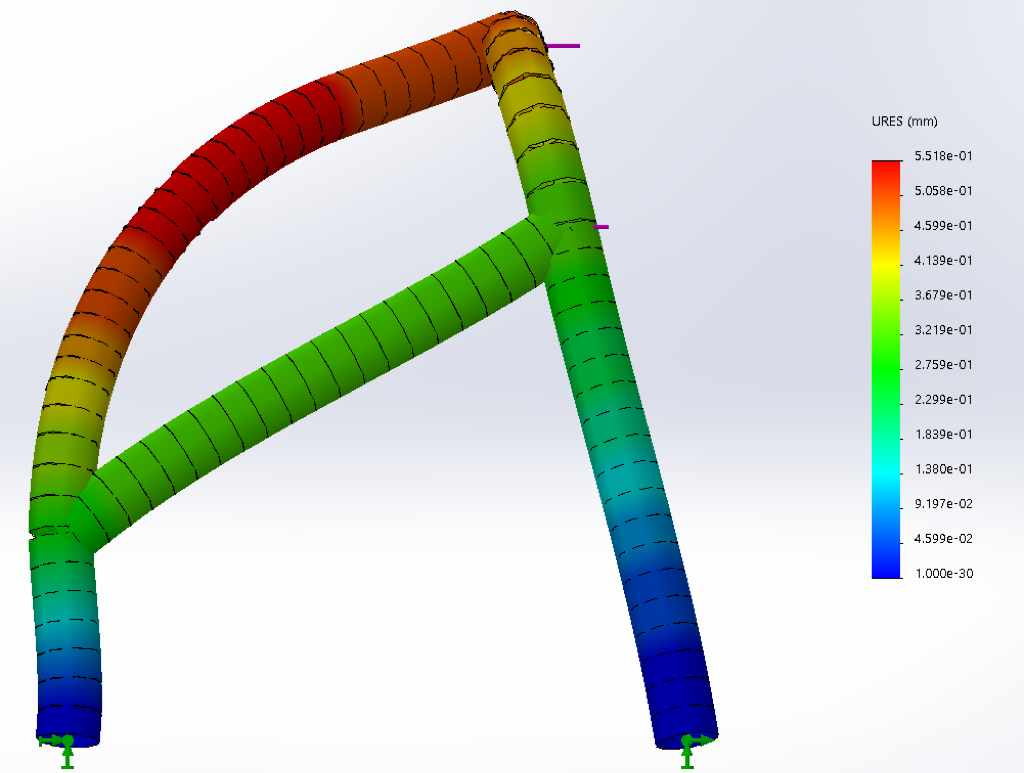
This is the same force simulation as the previous image but instead of force distribution, it shows the displacement in millimeters of each section due to the applied force. The greatest displacement, located in the red section, is shown on the bar as 5.5 x 10^-1 mm, which is 0.55mm. The maximum displacement is so small it wouldn’t even be noticeable. This is a good displacement to have because with the driver’s head in the vehicle so close to the frame, it would not be good if the bar got closer to their head. Especially because on impact, they will have a lot of forward momentum. The bar moving a lot in the opposite direction would certainly result in the driver hitting his or her head on the frame.
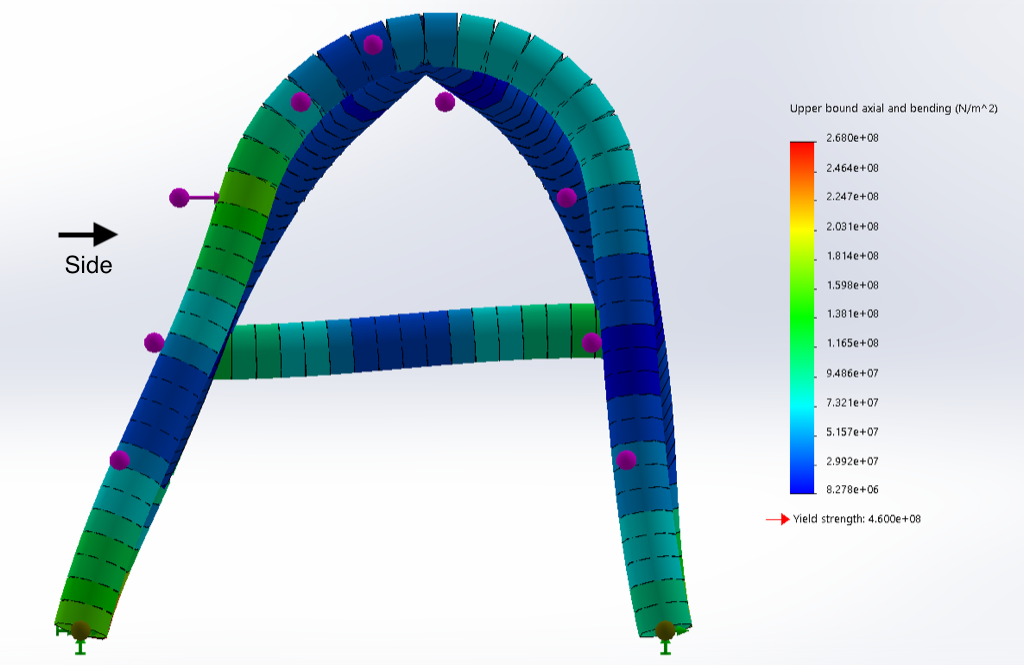
This is a force simulation applied to the side of the roll cage. 5x the force of gravity was applied based on the previously estimated mass of 450kg. This simulation shows the force distribution through the structure, similar to that of the simulated impact above. This one has a maximum stress of 2.68 x 10^8 Pa, which is still a lot less than 4.6 x 10^8 Pa.
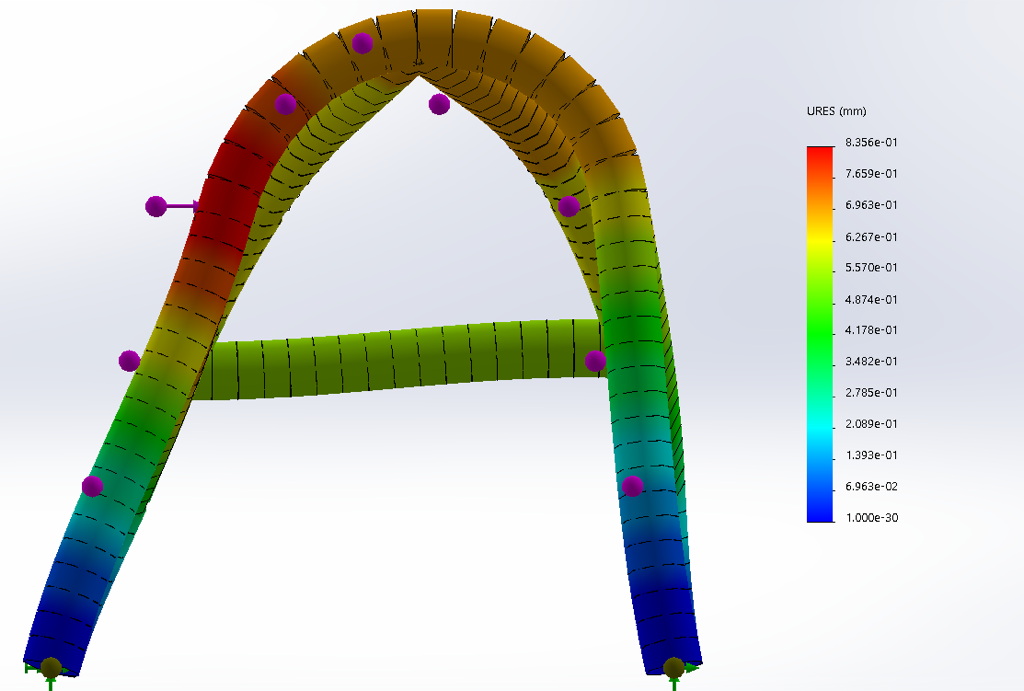
This is the same force simulation as the previous side load image but instead of force distribution, it shows the displacement in millimeters of each section due to the applied force. The greatest displacement, located in the red section, is shown on the bar as 8.356 x 10^-1 mm, which is about 0.84mm. The maximum displacement is so small it wouldn’t even be noticeable again. This is a good displacement to have for the same reasons as before.
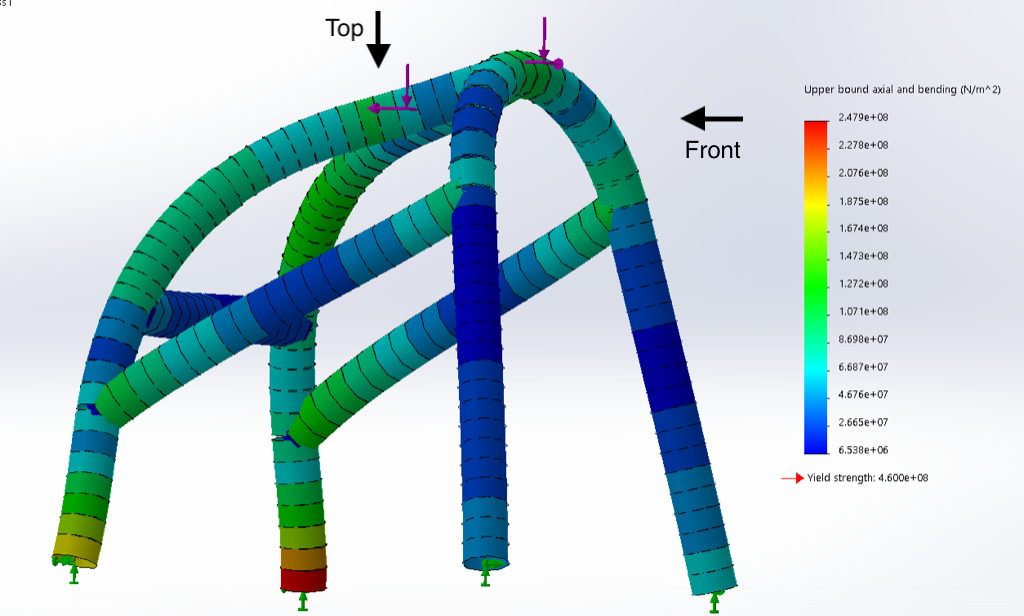
This is a force simulation applied to the top, front, and side of the roll cage. Based on an estimated mass of 450kg, 5x the force of gravity was applied on the top, and 1.5x was applied to both the side and front. This image shows the force distribution through the structure due to the applied forces, similar to the previous simulations. This one has a maximum stress of 2.479 x 10^8 Pa, which is still a lot less than 4.6 x 10^8 Pa.”
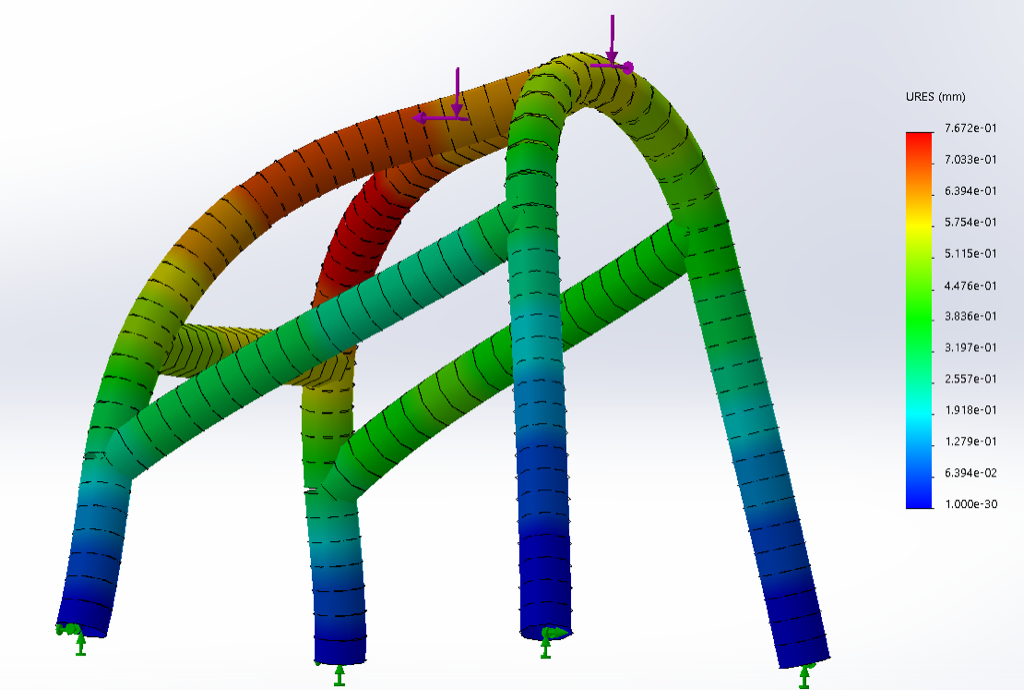
This is the same force simulation as the previous top, front, and side load image but instead of force distribution, it shows the displacement in millimeters of each section due to the applied force. The greatest displacement, located in the red section, is shown on the bar as 7.672 x 10^-1 mm, which is about 0.77mm. The maximum displacement is so small it wouldn’t even be noticeable again. This is a good displacement to have for the same reasons as before.